Ethereum (ETH) Price Prediction – Ethereum has experienced a price increase of 13.37% from low to high over the past 7 trading days. At the time of writing, Ethereum is currently trading hands at $470 and has lost 2.27% over the past 24 hours.
Created by Vitalik Buterin, Ethereum was designed to become a decentralised computing system to allow decentralised applications to run on top of. Many altcoin projects have elected to use the Ethereum blockchain as their main chain issuing ERC-20 Ethereum based tokens as their tokens.
Ethereum had recently been under fire regarding its transaction speeds. Ethereum can currently handle 25 transactions per second. This is tiny compared to the 1000s of transactions per second that Ethereum rivals can achieve. Ethereum became blocked up as the dapp CryptoKitties clogged the blockchain up causing backlogs of transactions for days.
Ethereum is currently ranked second in terms of overall market cap across the entire industry with a total market cap value of $47 billion. Ethereum has lost up to 22% over the past 30 trading days.
Let us continue to analyse price action over the long term.
Price analysis
Analysing the chart from he long term perspective above, we can see that the Ethereum market had experienced a bullish run toward the end of the year 2017, when price action rose from a low of $275 on November 2nd 2017 to an all time high of $1424 placed on the 13th of January 2018. This was a 400% increase in price from low to high.
After placing the high price action went on to depreciate, falling to a yearly low of $358 in April. The market had found support here as it was located near th .886 Fibonacci Retracement priced at $412. The Fibonacci Retracement was taken from the entire bullish run outlined above.
We can also see that the market has been trading within the confines of a very loose, symmetrical triangle. Price action has recently bounced off of the lower support boundary for the triangle.
If price action can break above the .786 Fibonacci Retracement, then this would leave the market open to continue to trade higher.
Let us continue to analyse price action a little closer over the more recent period
ETH/USD – SHORT TERM – DAILY CHART
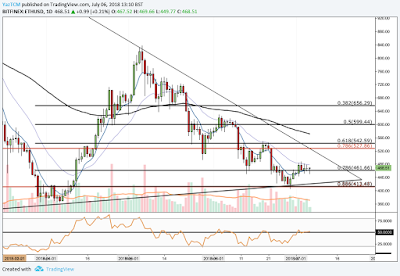
Analysing price action over the more recent term, we can see that the market had experienced a second, smaller bullish run during April when price action rose from a low of $358 on April 1st to a high of $838 on May 6th. This was a further price increase of 130% from low to high.
After placing this high, price action went on to fall, originally finding support at the .618 Fibonacci Retracement priced at $542, toward the end of May. This is a short term Fibonacci Retracement taken fro the bull run seen during April and is drawn in black. However, when June came along, price action fell further breaking below the .786 Fibonacci Retracement to find support at the .886 Fibonacci Retracement at a price of $413. IT is important to note that in this area there is a confluence of a short term and long term .886 Fibonacci Retracement, adding to the support found in this area.
Price action has currently, once again, found support at the .786 Fibonacci Retracement priced at $461. If the bullish momentum can continue to push the market higher, then the nearest level of resistance comes in at $542 which is the .618 Fibonacci Retracement. Resistance further higher than this level is located at June’s high close to $600 followed by the .382 Fibonacci Retracement priced at $656.
Alternatively, if the bearish pressure re-enters the market, the nearest level of support is located at the bottom boundary of the symmetrical triangle. Support following this level is located at the .886 Fibonacci Retracement followed by April’s low at $358.
The RSI has been in a major battle to break above the 50 handle. The past 3 times RSI attempted to break above 50 it failed. If the RSI can break above 50 this would indicate that the bullish momentum within the market is still growing.
I hope You can understand Ethereum (ETH) Price Prediction .


